Ancient Grains to Amazon Metrics: The Legacy of KPIs
Explore how KPIs have evolved from tracking ancient harvests to shaping modern business success through centuries of innovation.


Across centuries and civilisations, from Egyptian pyramids to Scottish mills and today's start-ups, humans have measured success to stay ahead. But how did we go from grain counts to glowing dashboards?
The first KPIs in history weren't numbers—they were grains.
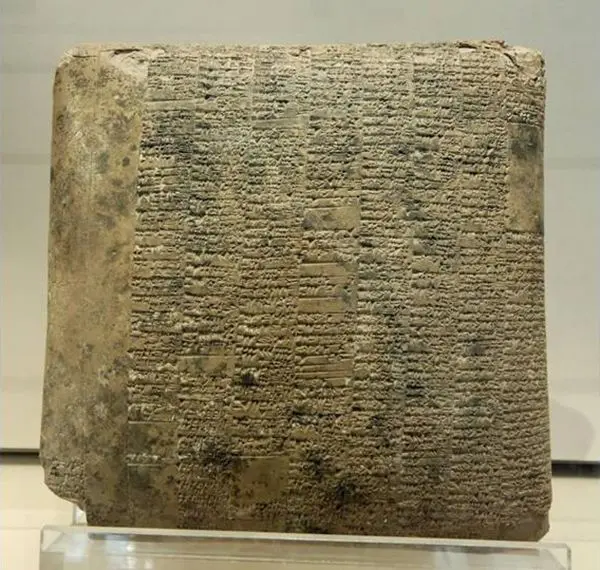
In the dusty archives of ancient Mesopotamia (c. 3100 BCE) lies one of the earliest examples of performance measurement: sacks of grain. Not recorded in spreadsheets but etched into clay tablets, the Sumerians meticulously documented how much harvest each field produced and who was accountable.
In Ancient Egypt, administrators tracked labour, materials, and timelines to build the pyramids - a striking example of early logistical planning. The records they kept were not just about monuments; they were about managing complexity.
By the 3rd century CE, China's Wei Dynasty began evaluating officials with rudimentary performance reviews to ensure good governance. Ancient Greece measured human excellence differently: the Olympics celebrated physical performance, while philosophers dissected the meaning of virtue and achievement. In Rome, record-keeping became a tool of empire. Officials tracked tax revenues, organised military logistics, and meticulously maintained infrastructure.
Centuries later, the Renaissance and Enlightenment ushered in a new age of measurement. Modern bookkeeping appeared, and governments began collecting population and economic data. Rationality triumphed; statistical thinking was born. These advances, once revolutionary, are now the DNA of today's Key Performance Indicators (KPIs).
The Birth of Modern Metrics: The Industrial Age Revolution
The 18th and 19th centuries brought a decisive shift in performance measurement. Industrialisation reshaped the world, multiplying the size and complexity of organisations. Factories, armies, and governments faced the same challenge: how to manage large-scale operations with precision. The answer lies in systematic metrics.
Factories and the Hunt for Productivity

With machines driving production, businesses turned a critical eye to labour and materials. How much output could a worker deliver? How much waste could be eliminated? Efficiency became the new gospel.
One pioneer in workplace metrics was Robert Owen, a Scottish mill owner and reformer. In the early 1800s, Owen introduced "silent monitors" at his cotton mills. These were wooden cubes painted in different colours to rate each worker's daily performance. Mounted above their workstations, the cubes said everything without a word, spurring accountability and improvement.
Despite their limitations, these early systems cemented the value of measurable performance. By standardising processes and fostering accountability, they laid the groundwork for aligning operational success with long-term strategy - an evolution from which we continue to benefit in the modern era.
The Rise of Financial Metrics: The Birth of KPIs
Modern performance management owes much to the rise of financial metrics. By the 19th and 20th centuries, businesses had embraced accounting systems that could measure efficiency and profitability precisely. The tools they developed—metrics like profit margins, return on investment (ROI), and cost of goods sold (COGS)—laid the foundation for today's Key Performance Indicators (KPIs).
DuPont, General Motors, and the ROI Revolution
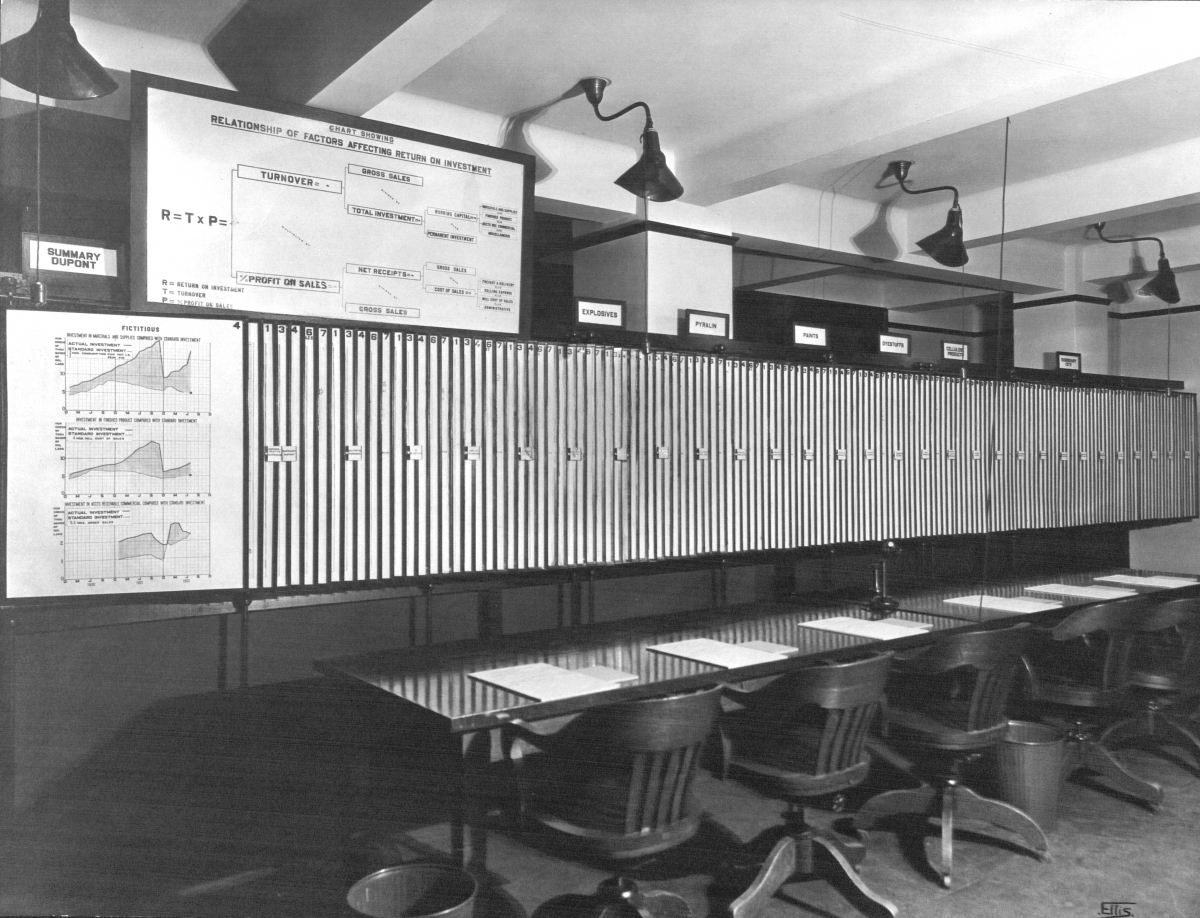
In the late 19th century, companies began using advanced accounting methods to gauge their financial health. But it was in the 1920s that DuPont and General Motors turned these metrics into strategic tools. Both companies pioneered decentralised management by creating "profit centres"—self-contained divisions responsible for their financial results.
Central to this innovation was the DuPont Chart, a groundbreaking model that made ROI the king of metrics. It showed, in clear terms, how profitability depended on investments and budgets. The system didn't just track performance; it forced managers to think like investors, linking every dollar spent to the bottom line.
The Tableau de Bord: A French Milestone
In the 1930s, French companies introduced the tableau de bord—an early version of the performance dashboard. This innovation allowed managers to track financial metrics at a glance, offering a clear view of their operations. While its use outside France remained limited at this time, the tableau de bord paved the way for the modern dashboards we rely on today.
These early tools brought order to the data chaos, enabling businesses to measure performance systematically. They connected daily operations to larger objectives, focusing on efficiency but hinting at a future where metrics would serve strategy, not just management.
From Efficiency to Strategy
By the mid-20th century, KPIs evolved. No longer just tools to monitor productivity, they became instruments of alignment — tying an organisation's goals to its daily actions. This shift marked the transition to the comprehensive, strategic Key Performance Indicators (KPIs) we use today.
Foundations of Strategic Goal-Setting
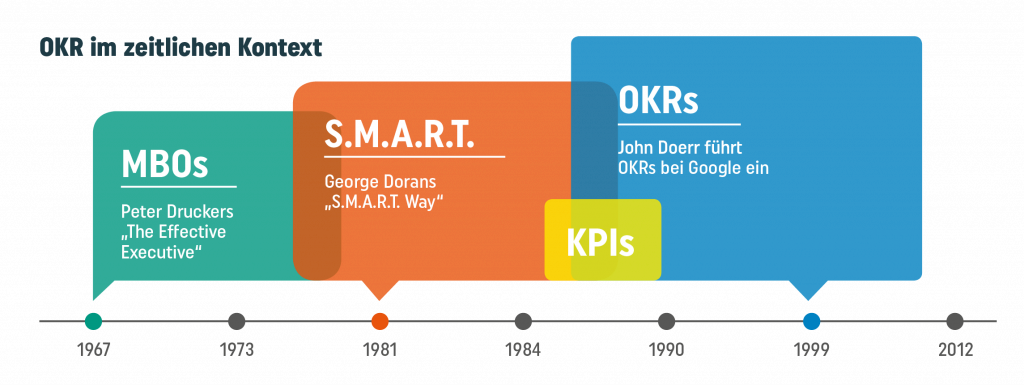
In 1954, Peter Drucker's Management by Objectives (MBO) redefined goal-setting. He insisted on clear, measurable objectives, a principle quickly embraced by companies like Hewlett-Packard, which tied goals to performance. In 1981, George Doran sharpened the approach with SMART goals—Specific, Measurable, Achievable, Realistic, and Timely. His framework stripped away vagueness and turned goal-setting into a precise, disciplined process.
By the 1970s, Key Performance Indicators (KPIs) had become essential for executives, zeroing in on the performance areas crucial to success. John F. Rockart described KPIs as "indicators that focus on critical aspects of performance essential for an organisation's success." By working directly with business leaders, Rockart refined his ideas, anchoring KPIs as a foundation of modern management.
A Performance Management Revolution
By the 1990s, a "performance management revolution" was in full swing. KPIs evolved from isolated metrics into a unifying framework, bridging vision and execution while aligning employees, departments, and leadership around shared goals.
This era also cemented key tools: the renaissance of France's tableau de bord and the ROI model, which tied financial outcomes to decision-making. These innovations formed the backbone of today's strategic performance measurement systems.
The Balanced Scorecard: A Breakthrough in Strategy
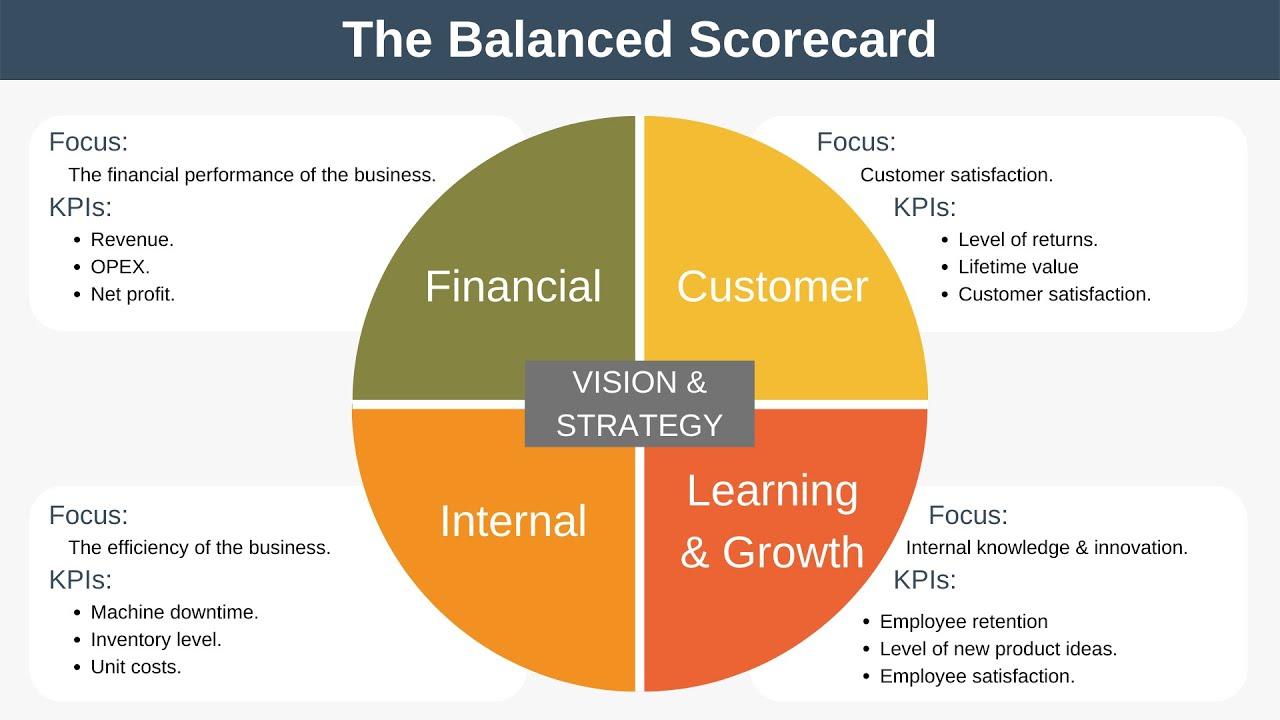
In 1992, Dr. Robert Kaplan and Dr. David Norton introduced the Balanced Scorecard, a revolutionary tool that linked metrics to strategic goals. "The Balanced Scorecard," they explained, "translates an organisation's vision and strategy into a coherent set of performance measures."
The tool focused on four key perspectives:
- Financial: Profitability and fiscal health.
- Customer: Satisfaction and market presence.
- Internal Processes: Operational efficiency and innovation.
- Learning and Growth: Employee development and adaptability.
The Balanced Scorecard stood out for its balance, tracking profits and intangible assets like innovation and customer loyalty. By the mid-1990s, Kaplan and Norton expanded its reach, cascading KPIs to departments and individuals. This ensured alignment with company strategy, turned goals into action, and fostered accountability at every level — making the Balanced Scorecard a core tool for linking strategy to daily operations.
The result? Organisations achieved what had long eluded them: a system where high-level goals guided daily operations, turning vision into reality.
The Technology Boom: Transforming KPI's
In the late 1990s and early 2000s, data analytics and BI tools transformed KPI use and accelerated the adoption of KPIs across organisations. Real-time tracking allows businesses to monitor performance and respond swiftly to changes. By the early 2000s, KPIs had become integral to strategy and operations.
The challenge shifted: it was no longer about creating KPIs but identifying the metrics that drive performance. Confronted with a flood of data, organisations had to focus on the indicators most relevant to their goals. The objective was clear: avoid drowning in numbers and concentrate on what matters most for business.
From Data to Action: The Power of Storytelling with KPIs
In the age of data overload, clear communication is as important as the data itself. In his 2020 work Information is Beautiful, data visualisation expert David McCandless highlights how visualising KPIs can transform raw numbers into actionable insights. "The way we present KPIs," he argues, "can greatly influence how they are understood and used. Good data visualisation can turn a KPI from a simple metric into a powerful tool for insight and action."
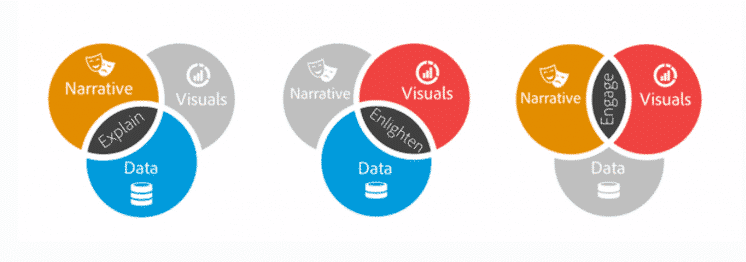
Brent Dykes, author of Effective Data Storytelling, builds on this idea by introducing three key aspects of data storytelling:
- Context: Every KPI needs a narrative. Without context, even the best metrics lack meaning.
- Clarity: Simplicity is key. Visualisations must highlight the most critical insights without overwhelming the audience.
- Connection: Data must resonate with decision-makers. Telling a story that links KPIs to real-world outcomes ensures buy-in and drives action.
By combining McCandless's focus on visualisation with Dykes's storytelling framework, KPIs become more than numbers. They become tools to inform, persuade, and inspire—turning data into decisions that matter.
OKRs: A Modern Revival to Complement KPIs
First introduced at Intel in the 1970s, Objectives and Key Results (OKRs) were reborn in the 21st century, championed by Google and adopted widely in the tech world. This goal-setting framework aligns individual, team, and organisational objectives with measurable outcomes, emphasising ambition over routine.
Unlike KPIs, which measure ongoing performance against set benchmarks, OKRs focus on stretch goals—targets designed to push teams beyond their limits. Their resurgence came as organisations embraced agile methods and sought adaptability in fast-changing industries. OKRs became a tool for driving innovation in environments where standing still means falling behind.
Paired with KPIs, OKRs strike a vital balance. KPIs ensure organisations stay on course, while OKRs foster progress and creativity. Together, they merge stability with aspiration, providing a steady hand and a bold vision for the future.
The North Star Metric and Lean Analytics: Key Drivers of Modern Business Strategy
The North Star Metric (NSM) and Lean Analytics have gained popularity in recent years. They offer clear frameworks for driving focused decision-making throughout the organization.
Coined by Sean Ellis, the NSM identifies the single metric that captures a company's core user value. Facebook tracks Daily Active Users, Airbnb measures nights booked, and Spotify monitors listening time — each metric unifies teams and clarifies growth strategies.
Emerging from the Lean Startup methodology, Lean Analytics extends this philosophy through the "One Metric That Matters" (OMTM), adapting key measures to each growth stage. This approach, popularized by Alistair Croll and Benjamin Yoskovitz, emphasizes tracking the right metrics at the right time.
Lean Analytics helps businesses identify their OMTM at each growth stage, preventing data overload and directing resources toward meaningful progress. It facilitates rapid experimentation and iteration, allowing companies to adapt swiftly to market feedback.
Lean Analytics + OKRs: Powering Strategic Growth
Lean Analytics and OKRs form a powerful partnership. Lean Analytics uncovers critical metrics driving business success, while OKRs translate these insights into concrete objectives and measurable outcomes.
By combining Lean Analytics' data-driven insights with OKRs' focused execution framework, organizations create a feedback loop of measurement, action, and improvement. This integration ensures strategic priorities identified through analytics directly shape executable goals and trackable results.
From Metrics to Meaning: The Next Evolution
From ancient Sumer's grains to modern business strategies, one truth remains: the human drive to measure and improve is timeless.
Today, organizations face a deluge of data and shifting market dynamics. KPIs are no longer just about measurement — they're about transformation. The best KPIs don't merely report results; they shape decisions, energize teams, and align efforts with a clear purpose.
Once basic tracking tools, KPIs have evolved into engines of strategy and innovation. They drive decisions, enforce accountability, and inspire action. In a world of growing complexity and competition, the challenge isn't collecting data but focusing on the insights that truly matter—those that propel progress, purpose, and impact.
Yet, one question remains: Where does your organization stand in this evolution?
Written by

Subscribe to my newsletter
Subscribe to my newsletter to get the latest updates and news